Lab 4
GUIs and Algorithms 🧑🔬
Labs provide hands-on experience with course material. They have three parts: review questions, guided exercise, open-ended exercise.
The first few Labs provide practice with fundamentals, and the later Labs go hand-in-hand with the term project check-ins.
Tips are at the very bottom. You should read them.
Part 1/3: Review Questions
- Give a succinct and accurate definition for what an algorithm is.
- Define CRUD and give a real life example of a use for each letter.
- Define GUI and give some real life examples.
- Define scatterplot, barplot, and histogram, and give a few real life examples of when would be appropriate to use each.
- If your algorithm has three nested for loops (a loop inside a loop inside a loop), what equation might we expect to represent the efficiency of that algorithm?
- Same question, but if we have three loops, one after the other?
- (Come back and answer this question after completing the rest of the assignment) What problems, if any, did you encounter at any point in this Lab? What did you do to overcome them?
Part 2/3: Guided Exercise
https://www.youtube.com/watch?v=iFQMzmp7_f8
In this lab, we'll be creating a GUI design, loading it into Python, loading data into Python, plotting that data, and making that app interactive so the user can choose which version of the plot to show.
First, download the data we'll be working with by right clicking this link, lab4_data.csv, and saving the file as lab4_data.csv, then add it to a new python project.
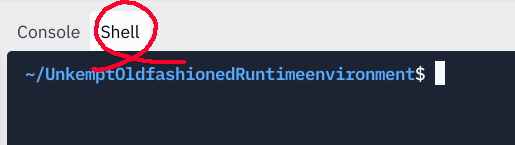
Second, create a new repl.it and click on the Shell button.
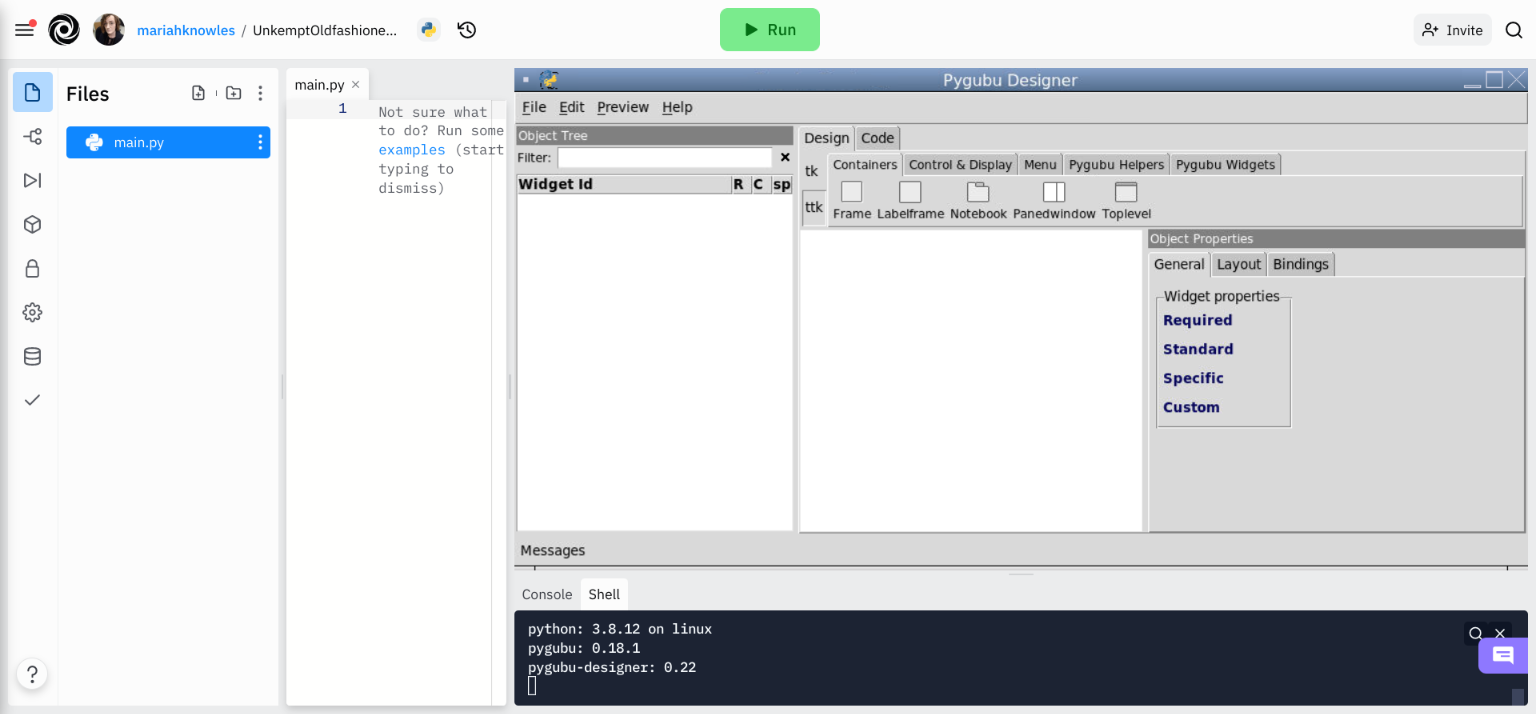
Third, run these commands in the Shell:
pip install pygubu-designer
pygubu-designer
A GUI window named Pygubu Designer should appear after a moment (if it doesn't, keep reading). Adjust the size of the window as necessary to make it easy to see.
If you got an error message like /usr/bin/env './python3': No such file or directory when you tried to run pygubu-designer, try this instead. In your main.py write the following code and hit run:
from pygubudesigner.main import start_pygubu
start_pygubu()
Fourth, in your Designer, under the Design/Container tab, click the TopLevel button once. Under the Object Properties pane on the right side, set the id value to window.
Fifth, under the Design/Container tab, click on the Frame button once. Set its id to button_row. Under the Layout tab of its Object Properties, set padx and pady both to 10.
Sixth, under the Design/Control & Display tab, click on the Button button once. Set its id to button_all_clients, and scroll down and set its text to All Clients. Do the same thing to add a button with an id of button_by_job and a text of By Job, and another with button_by_edu and By Edu.
Seventh, for all three buttons, go to the Layout tab of their Object Properties and change their side to left. (You can go back to a previous button you made by clicking on its name under the Widget Id pane on the left side.) You should now see your buttons rearrange to be next to each other horizontally.
Eighth, select the window: tk.TopLevel object under the Widget Id pane, then click Design/Container/Frame once. Give this frame an id of canvas_frame.
Your Pygubu Designer window now should look similar to mine:
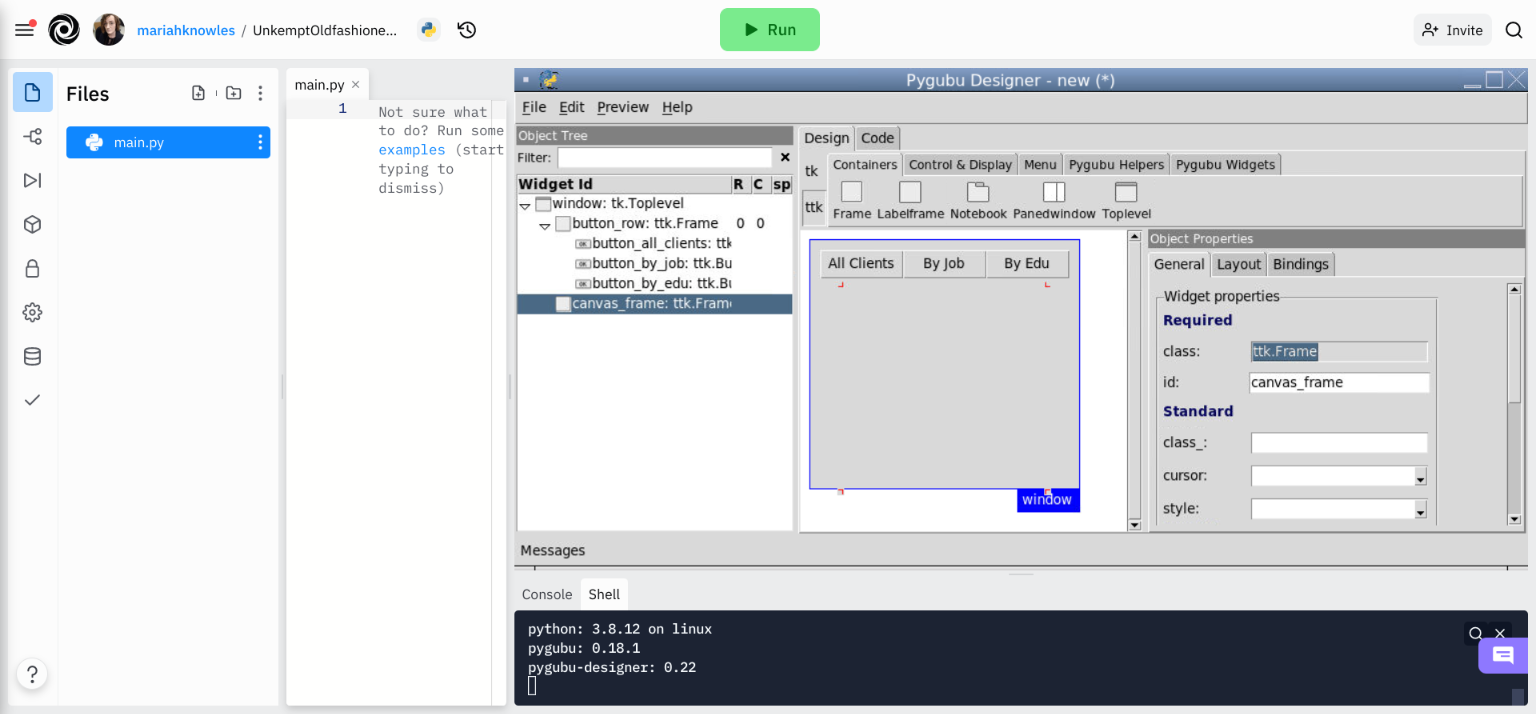
Once you have it looking like mine, embed screenshots showing your design.
Ninth, still in Designer, click File/Save As and save it as lab4_design.ui. (If you close Designer, you'll have to re-open it in a few steps. In that case, you can re-open your saved work by going to Designer / File / Open recent... and clicking on lab4_design.ui.)
Tenth, let's load our GUI into python. Setup your main.py like so and press run:
# Imports
from pygubu import Builder

# Build our app
app = Builder()
app.add_from_file("lab4_design.ui")
window = app.get_object("window")
canvas_frame = app.get_object("canvas_frame")

# Our app is ready, let's go!
window.mainloop()
Embed screenshots showing your design running.
Eleventh, let's plot the data we downloaded earlier and embed that in our app too:
# Imports
from pygubu import Builder
from pandas import read_csv
from matplotlib import rcParams
from matplotlib.pyplot import Figure
from matplotlib.backends.backend_tkagg import FigureCanvasTkAgg
rcParams.update({"figure.autolayout": True})

# Build our app
app = Builder()
app.add_from_file("lab4_design.ui")
window = app.get_object("window")
canvas_frame = app.get_object("canvas_frame")

# Load data
data = read_csv("lab4_data.csv", sep=";")

# Attach a matplotlib Figure to our GUI's canvas frame
fig = Figure(figsize=(4, 3)) # 4 in wide, 3 in tall
canvas = FigureCanvasTkAgg(fig, master=canvas_frame)
canvas.get_tk_widget().pack()

# Plot data in that figure
axis = fig.add_subplot()
data.plot(
  ax=axis,
  kind="hist",
  y="balance"
)

canvas.draw()

# Our app is ready, let's go!
window.mainloop()
Embed screenshots.
Twelfth, let's setup those buttons to do something when we click them. Back in Designer, click through each of the buttons, go to their Object Properties, and scroll down. Set their Callback values to click_all_clients, click_by_job, and click_by_edu, respectively. Be sure to save your changes with File/Save everytime you're done making edits to the design.
Fourteenth (skipping 13), back in your python code, add this right above your last line:
def click_all_clients():
  print("HI!")

def click_by_job():
  print("HI!")

def click_by_edu():
  print("HI!")

app.connect_callbacks({
  "click_all_clients": click_all_clients,
  "click_by_job": click_by_job,
  "click_by_edu": click_by_edu
})

# Our app is ready, let's go!
window.mainloop()
Run your code again and make sure when you click each button, the message "HI!" is displayed in your console in the bottom right of your repl.it screen.
Fifteenth, let's make the buttons do something more interesting. Replace the logic for the first two methods above with:
def click_all_clients():
  fig.clf() # clear figure contents
  axis = fig.add_subplot()
  data.plot( # draw a plot
    ax=axis,
    kind="hist",
    y="balance"
  )

  canvas.draw() # update app

def click_by_job():
  fig.clf() # clear figure contents
  axis = fig.add_subplot()
  job_sums = data.groupby(["job"]).mean(numeric_only=True) # average by job category
  job_sums.plot( # draw a plot
    ax=axis,
    kind="barh",
    y="balance"
  )

  canvas.draw() # update app
Run again, make sure you can click between All Clients and By Job, and embed screenshots of each.
Sixteenth, edit the click_by_edu method so it does the same as click_by_job, except replace the word "job" with "education" everywhere. Embed screenshots showing that plot working too.
Seventeenth, add another button to your design, re-save your design file, and add the appropriate logic to your python. This button should say "By Marital" and when you click it, it should show a bar plot showing the average for each marital group, similar to what we did with job and education above. Embed screenshots of your final code and results.
Finally, interpret your results: These plots show bank account balances for several bank customers. What categories have the highest and lowest bars for each plot that we made? Do these results make sense? Why or why not?
Optional Fun Exercise
A little different of an optional exercise this Lab. Even if you don't do steps 1-4, step 5 would be appreciated!
Step 1 - Read the following article: https://living.aahs.org/behavioral-health/taking-care-of-your-mental-health-in-a-time-of-uncertainty/
Step 2 - Engage in one of the following activities:
- Cook a meal that brings you joy
- Go on a (socially distance) neighborhood walk
- Have a video chat with two classmates
- Watch your favorite childhood movie
- Engage in physical exercise
- Engage in a guided meditation
- Play a board game with your family, children, partner, etc.
- Video chat with a friend you have not spoken to in a long time
- Call a family member whom you have not spoken to in a long time
- Create a vision board on Pinterest
- Stay off of social media for 24-hours
- Do something that used to make you happy as a kid
- Read something for pleasure
- Engage in creative writing
- Make art
- Take a good nap
- Other ideas are welcome!
Step 3 - In the Check-in 4 board (just to have a place to put it), make a post titled "(your name)'s Wellness Activity" and upload a photo of your activity (if possible and if you’re comfortable doing so)
Step 4 - In no more than 150 words or 2-minute audio clip explain how this activity supports your mental health and well-being, and describe the ways in which you can continue to build in self-care during this time
Step 5 - Give kudos to at least 2 other people in the thread. Support them for taking time for self-care!
Part 3/3: Open-Ended Exercise
The word CAT can be rearranged the following ways:
CAT
CTA
ACT
ATC
TAC
TCA
Write a program that will ask the user to enter a word.
Convert that word to all caps, then output all possible orders of the letters of that word.
If your program outputs the same thing twice, such as because the same letter occurs twice in the user's input, then that's fine.
What matters is that (1) your program runs, (2) your program finishes running, and (3) your program outputs all possible rearrangements.
Embed screenshots showing your program working for:
CATDOGDOGGOTACOCAT
Submission
Complete Parts 1, 2, and 3 in a single Word/etc. document, then submit your document as a Word or PDF file (NOT a .pages file) to Blackboard.
Grading
Each Lab is worth 6/100 towards your final grade.
6/6 - Great job, maximum points! The student completes the Lab accurately and sufficiently and honestly, demonstrating the best of their ability.
3/6 - Student completes most but not all of the Lab. Or, student completes the Lab, but only to the minimal letter of the prompt, not actually applying the concepts of the unit. If you encounter problems or have questions, be sure to email me well before 24 hours before the due date, then continue to attempt to resolve the issue on your own while you wait for a reply.
1/6 - Student completes less than half of the Lab with sufficient work, or student leaves entire sections blank. Make sure that you are leaving yourself enough time to complete assignments, as usually students submit incomplete work because they were rushed at the last minute.
0/6 - Student does not submit on time or submits plagiarized or unacceptable work. Double check that you have submitted the right file, as usually students get zeros because they submitted a previous week's work by accident.
Tips
How do I convert a string to a list, and back?
my_string = "hello"
my_list = list(my_string)
my_string_again = "".join(my_list)
How do I show all possible orderings of a list?
The "all possible orderings" problem is also known as the "permutations" problem. In theoretical computer science, this is intimately related to the "combinations" problem.
Permutations asks for all possible ways to rearrange a given sequence. If your sequence as n items, then there are n! (factorial) possible orderings.
Combinations asks for all possible ways to select k items from a sequence of n items. There are...

...possible ways to select k items from a sequence of n items.
Long story short of those equations: As n gets just a wee bit bigger, the number of items you'll need to output gets BIG, FAST.
A great tutorial that walks through both of these, using built-in Python tools, is https://www.askpython.com/python/permutations-and-combinations-using-python.